Introduction
The foreign exchange market stands as the largest financial market globally. One of the most essential tools for traders to understand market trends and perform market analysis is through forex charts.
Forex traders in the UAE used charts to track the historical performance of a currency pair allowing them to identify patterns and spot investment opportunities.
Moreover, these charts serve as a valuable tool for refining trading strategies, thereby facilitating informed decision-making that could lead to enhanced profitability. This blog has been curated to provide you with an understanding of forex charts and a guide on how to interpret them effectively.
What are forex charts?
The Forex chart, a crucial tool for traders, serves as the visual representation of the price movement of a particular currency pair over a specified duration. This duration could vary anywhere from a few hours, such as 5 hours, to a longer period like a week or even months.
The primary function of the chart is to aid in the execution of technical analysis. By providing a clear and organized visual of price movements, it simplifies the process of analyzing the forex market. This, in turn, makes it easier for online traders to identify patterns, understand market trends, and ultimately recognize potential trading opportunities.
Start trading with GCFX today and get access to charts that cater to all levels of trading proficiency, from simple charts for beginners to more advanced charts for market analysis and executing trading strategies.
Interpreting commonly used forex charts
Line charts
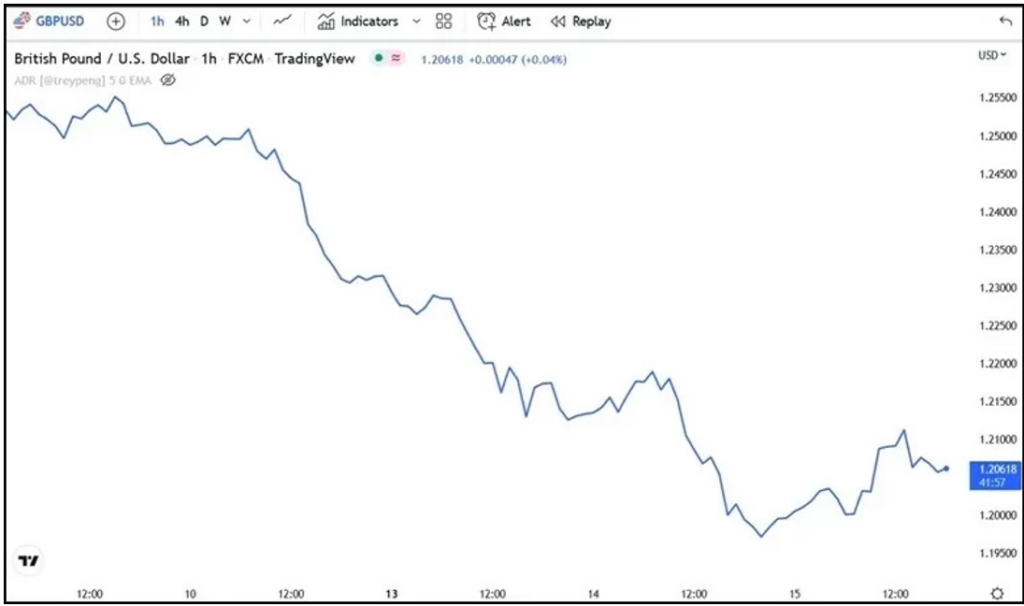
A line chart is one of the simplest types of forex charts, making it an ideal entry point for those new to forex trading. It is formed by joining the dots from one closing price to the next, resulting in a line that offers traders a visual of the market trends over the selected time frame.
The strength of a line chart lies in its simplicity. It might not offer the detailed data found in more complex chart types, but it allows traders to concentrate on the overall trend by filtering out the distractions caused by short-term price fluctuations.

Advantages of a line chart
- Its simplicity makes it easy to understand and interpret, particularly for those new to trading.
- It offers a clear and straightforward visual representation of the overall market trends.
Disadvantages of a line chart
- It does not offer detailed information like open, high, and low price prices that other more complex charts provide.
- It fails to convey intra-period price fluctuations, which could be valuable for short-term or day traders.
Bar charts
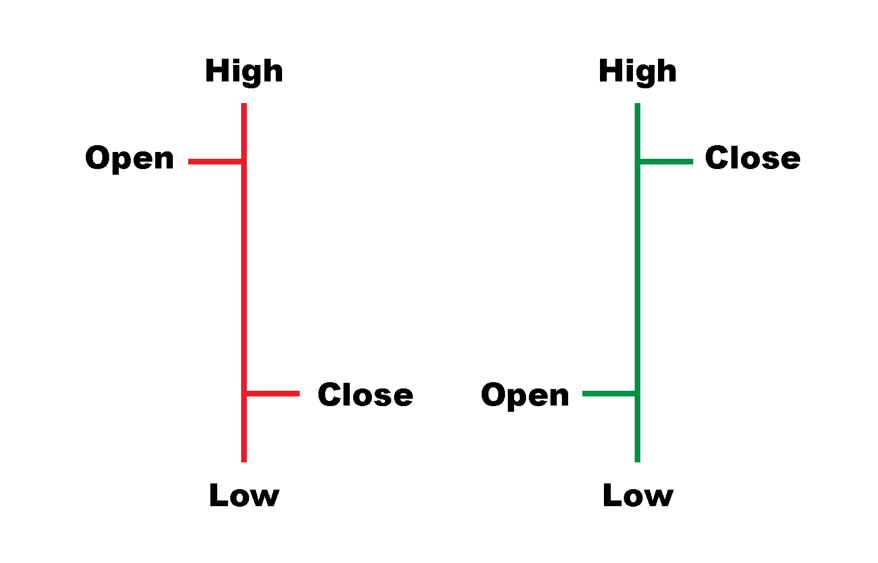
A bar chart, also called an OHLC chart, is a visual tool displaying the price movements of a currency pair over a selected timeframe.
Each ‘bar’ on the chart signifies a specific period, such as an hour, a day, or a week, with its length indicating the total variation in prices during that period. The top and bottom of the bar indicate the highest and lowest prices, respectively. The bar also has two small horizontal lines extending out from it. The line on the left represents the opening price, and the line on the right represents the closing price of that period.
Essentially, this chart is like a snapshot of the price journey within a specific timeframe. It tells you where the price started (open), where it ended (close), and how high or low it went in between (high and low).

Advantages of a bar chart
- They offer not only closing prices but also opening, highest, and lowest prices, aiding in understanding market volatility.
- Price patterns and trends are clear, offering insights and visual clarity into market dynamics.
Disadvantages of a bar chart
- The information displayed is dense compared to a line chart and hence it can overwhelm novice traders.
- Unlike candlestick charts, they don’t use colour to indicate market conditions, making trend identification harder.
Candlestick charts
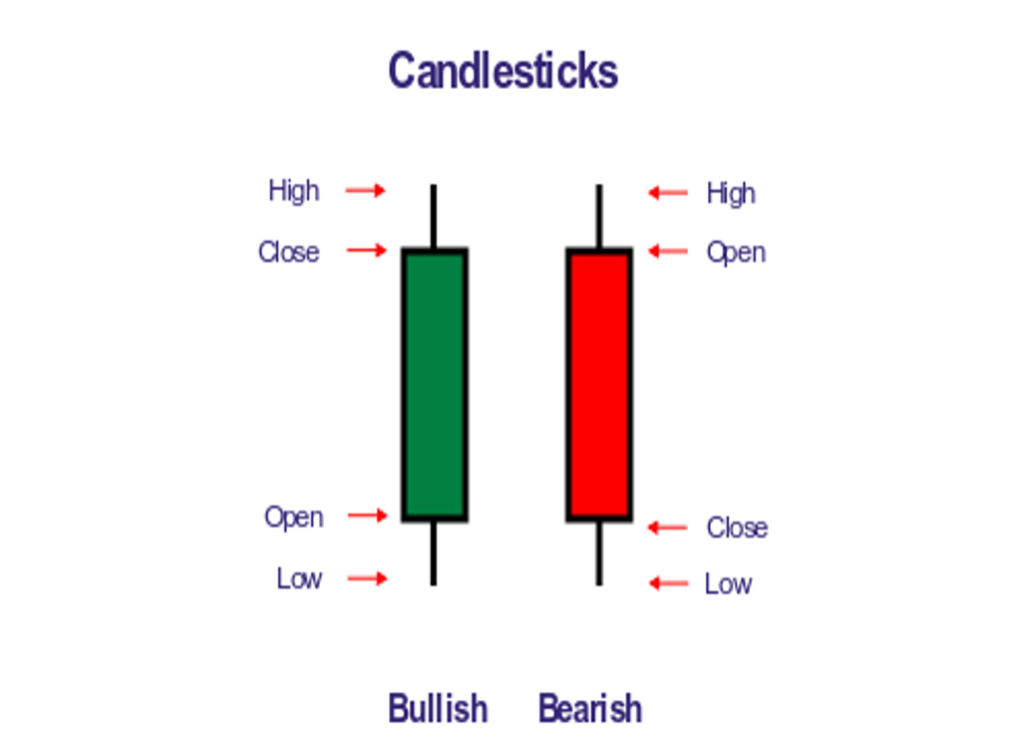
Candlestick charts are the most detailed and commonly used type of Forex chart. Each “candlestick” on the chart tells about the price journey over the time frame selected. Similar to bar charts, they present the opening, closing, highest, and lowest prices for a specific period.
What sets candlestick charts apart is their use of colour and shape to provide additional information. If the closing price is higher than the opening price, the candlestick is coloured white or green, indicating that the market is bullish.
Conversely, if the closing price is below the opening price, the candlestick is usually black or red, pointing to a bearish market.
The ability to provide this information by forex brokers in the UAE makes candlestick charts an indispensable tool for traders, aiding in the identification of market trends and the prediction of future price movements.

Advantages of a candlestick charts
- Candlestick charts offer detailed price data such as opening, closing, high, and low prices in a specific period, aiding traders in comprehending price fluctuations.
- The use of colours in candlestick charts makes it easy to identify bullish and bearish market conditions leading to better decision-making.
Disadvantages of a candlestick charts
- Traders might rely too heavily on candlestick patterns or misinterpret the signals given by candlestick patterns leading to incorrect trading choices
- Candlestick charts are mostly suited for short-term trading and might not be the best choice for long-term investment strategies.
Final word
We’ve discussed the most fundamental and commonly used charts in currency trading however keep in mind that there’s a variety of other charts used by traders for technical analysis. Depending on your personal preferences, you might find yourself utilizing one or a combination of different charts.
The ability to accurately interpret forex charts is a crucial skill that every forex trader must master. These charts serve as essential tools that provide required data for making comprehensive market analyses and informed decisions, which are key to successful trading.
Join GCFX and equip yourself with the right resources and knowledge to make the most out of your forex trading journey.
